Two Years, No Fuel, No Regrets - What Really Happened When My Family Switched to EVs
Published on 16th March 2026 by Simon Fearby
After two years and thirty thousand kilometres of fuel-free driving, here's an honest look at what it really costs when your regional Australian family makes the switch to electric.
I have a Tesla Model Y Long Range 2023, My wife has a BYD Shark 6 (Electric Drive Train with Electric Generator) and fast swill be drawn from this and other family and friends EV experience. This is my opinion only, do fact check and run your own numbers before buying an EV.
Before the purchase
Before I switched to an EV, I did much research. EVs in regional Australia where I live were not very common.
I spent too much time on Reddit and YouTube consuming information. If you do one thing check out https://www.youtube.com/@bjornnyland/videos. He has so many video on testing Electric cars it is mind boggling.
Family and friends were saying things like...
- The battery will degrade and need replacing in 10 years.
- You will only get 100km of range.
- The battery will catch fire.
- EVs damage the environment more than petrol cars.
- EVs have no soul to drive.
- You will use coal to charge the car, why not use Petrol.
0 to 3 Months Experience
- I learned how to use https://www.plugshare.com/ to see where public chargers were before long trips.
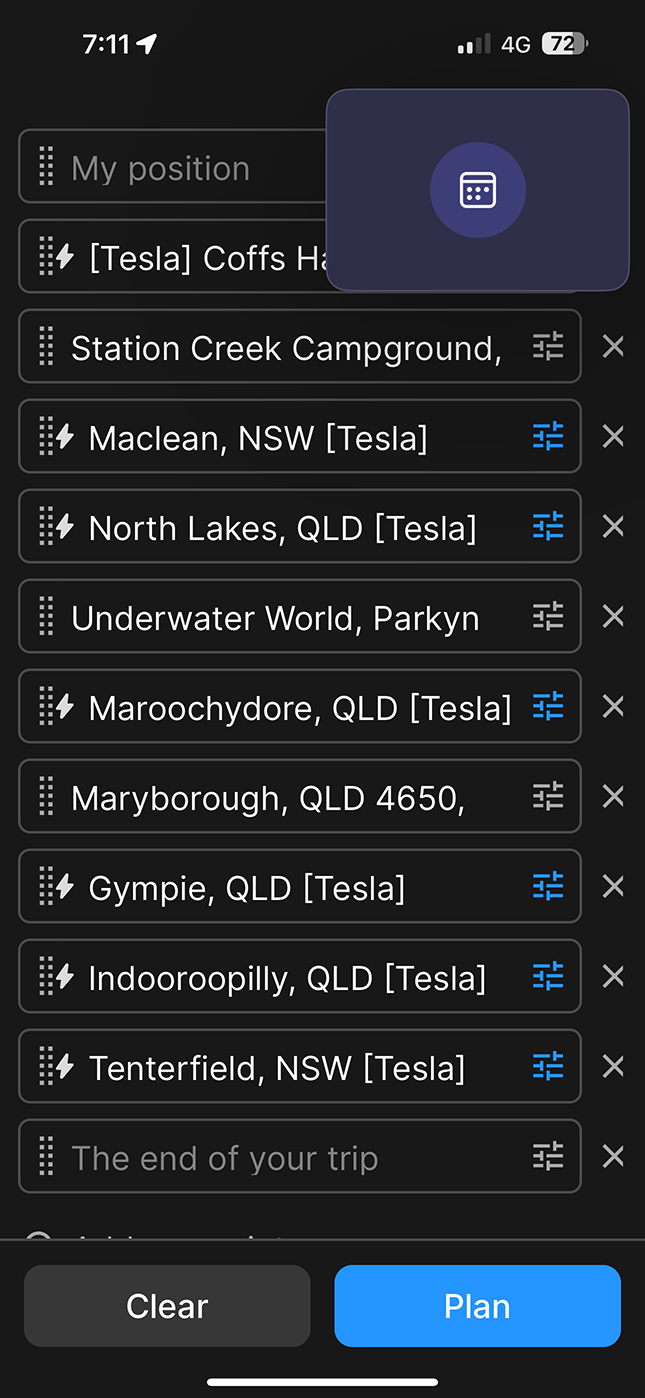
- I learned how to use https://abetterrouteplanner.com/ to see simulate an plan long trips and see if I needed to charge and where.
If you are thinking of getting an EV or PHEV you will need to use Plugshare and ABRP to compliment your cars navigation and route planning.
Do not be like me on our first long road trip over planning on paper
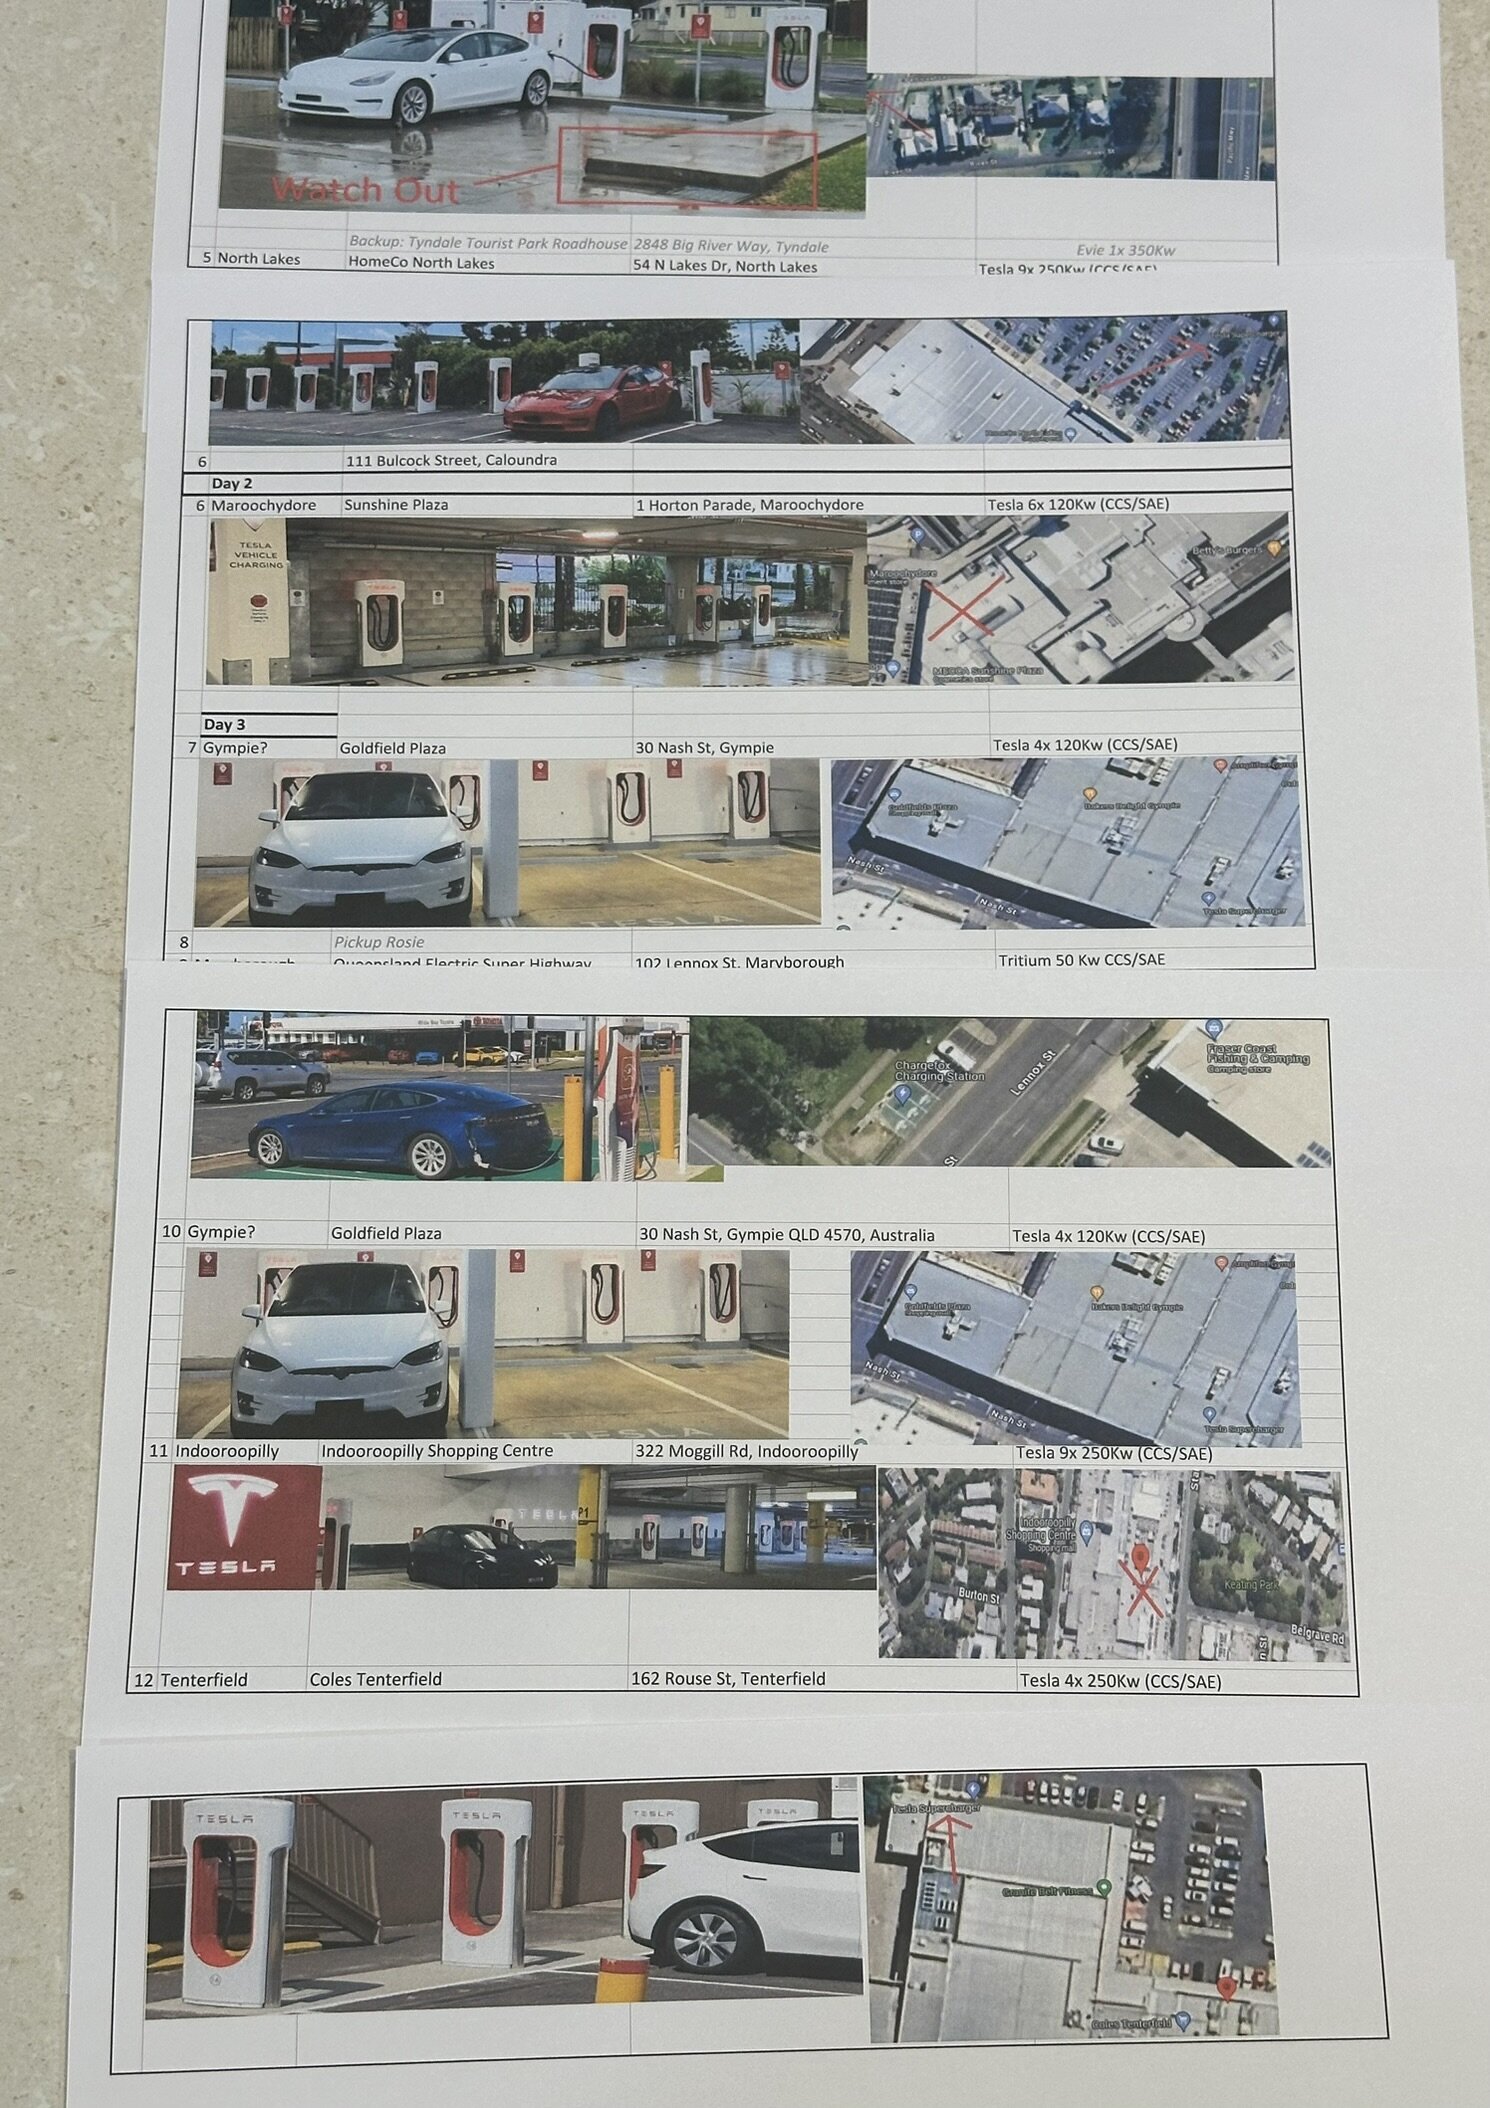
If I had my time again, I would have just use ABRP and not over planned.
6 ~ 12 Months
In the first 6 to 12 months I was still concerned about charging on long trips
- Charging an EV - 10th August 2024"
- Is an EV A Good Idea For Me? - 15 August 2024
- EV Fear, Uncertainty and Doubt - 9th December 2024
I carried all the charging adapters for the worse case scenario

12 Months ~ 2 years.
After 12 months I sold my unused 3 phase adapters, caravan camping charging plugs and learned to trust the cars navigation and head off on long trips with no hesitation.
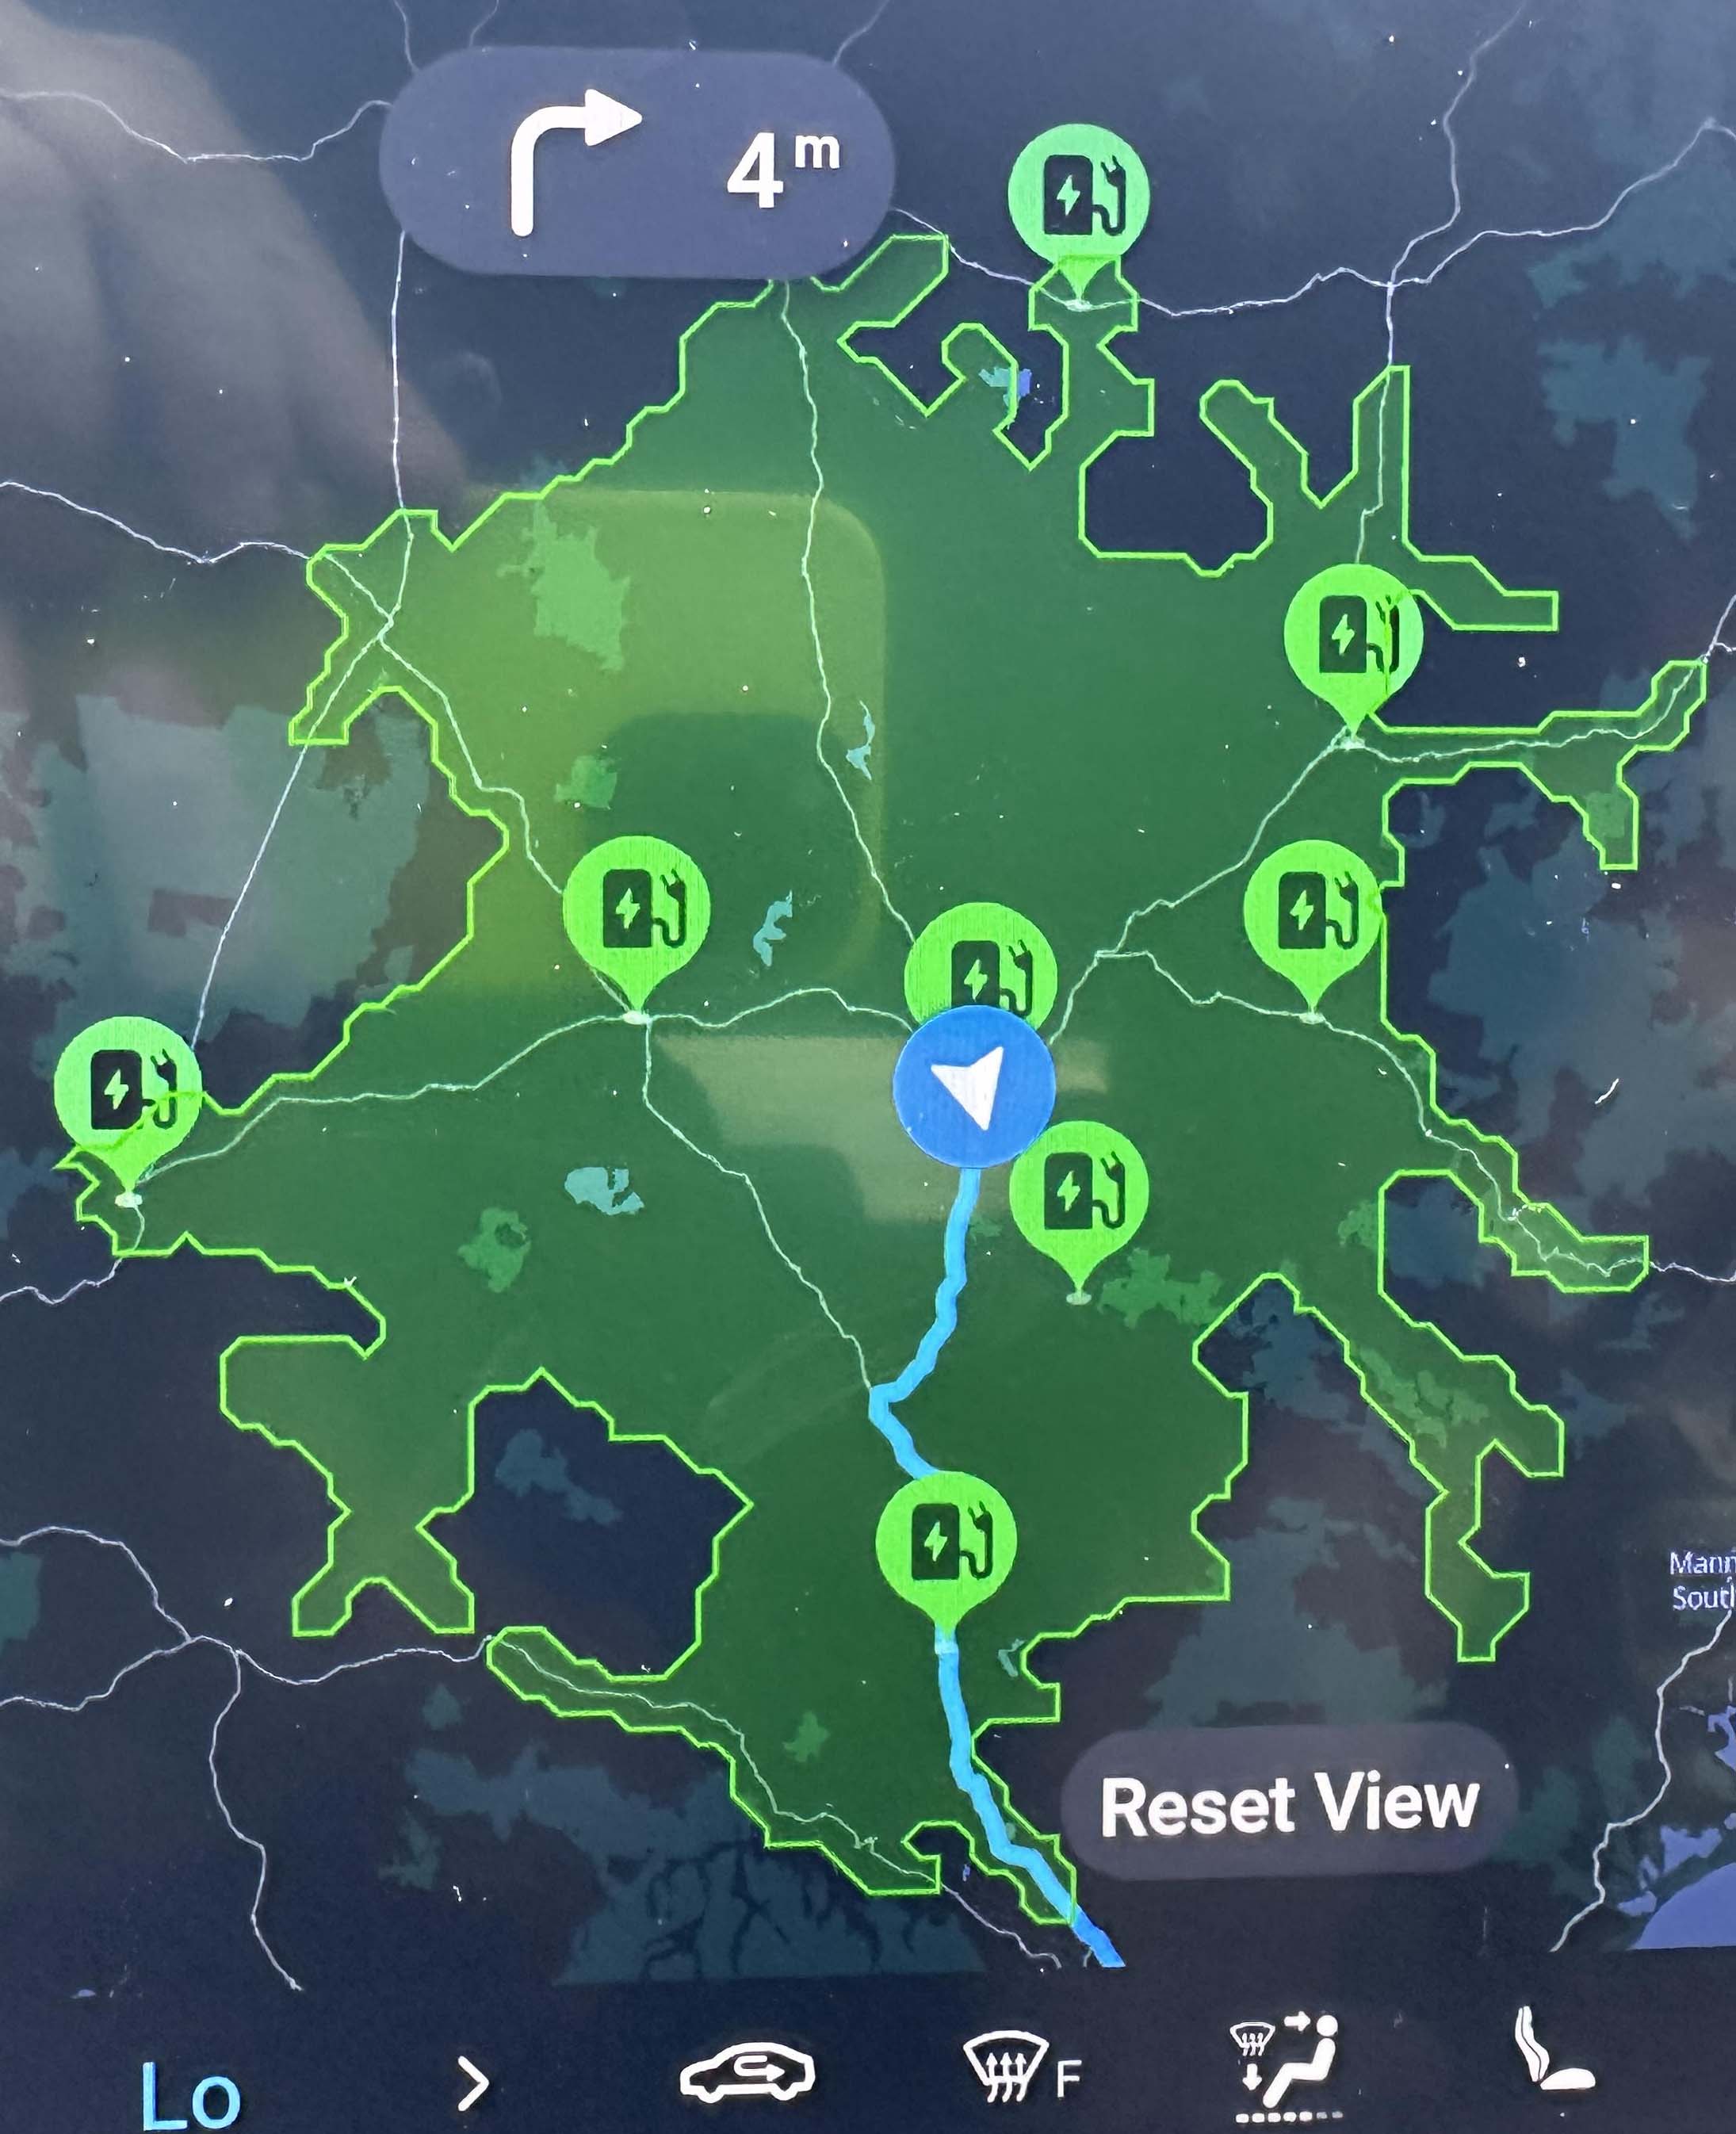
I was comfortable with the car doing the maths and saying when I needed to stop and take a break and charge.
My only adviced is to enter your destination into your cars navigation screen before long trips (BYD and Tesla navigation works well) and trust the car.
The last 2 years have been great. Our Tesla has been no troubles and my wife got a BYD Shark 6 and has not used a drop of fuel in the last few months.
.The Facts
I see you are still reading, congratulations. Here ware some facts EV haters will deny.
Battery DegradationTesla batteries degrade slower than most early EV sceptics predicted. Real-world data from the Tesla community and Teslarati tracking shows most Model Y and Model 3 batteries retain around 90% capacity after 100,000km, with degradation slowing significantly after the first year. The LFP chemistry used in Standard Range variants degrades even less over time.
Replacement Cost (Worst Case)A full Tesla battery replacement in Australia currently runs approximately $10,000–$20,000 AUD depending on the model and pack size - but this is increasingly a theoretical figure for most owners. The Tesla battery warranty covers 8 years or 240,000km (whichever comes first) for Long Range models, guaranteeing at least 70% retention - so early replacement is rarely a real-world cost.
The average yearly maintenance cost of a Petrol car is $900/y or $9000 in 10 years (and that is on the low side.). If petrol was $1.8 a litre (currently $2.55 a litre) over 10 years if you filled up 50 litres every 2 weeks that's $23,000 in 10 years.
I'd rather had a electric car and wait an extra 5 to 10 minutes public charging on long trips if degradation took away 50km range in 100,000km time before replacing the battery (or charge at home.
EV Battery Technology: It's Not Just About NCM AnymoreOne of the biggest myths around EVs is that all batteries are created equal - or that early battery concerns still apply today. Battery chemistry has moved fast. Here's a plain-English rundown of where things are at.
LFP (Lithium Iron Phosphate)LFP has gone from the "budget option" to the dominant global EV battery chemistry. In 2025, LFP deployments overtook traditional nickel-based (NCM) chemistries for the first time globally, driven by lower cost, longer cycle life, and significantly better thermal safety. LFP batteries use iron and phosphate - widely available, cheap materials - instead of cobalt and nickel, which carry both cost and ethical supply chain baggage. Tesla, Ford and BYD have all moved to LFP for their mainstream EV models because it's safer, degrades slower, and can be charged to 100% daily without the same wear issues as NCM. The IEA's Global EV Outlook 2025 confirms LFP's growing dominance as the go-to chemistry for mass-market EVs.
BYD Blade BatteryBYD's Blade Battery is a clever structural evolution of LFP. Instead of traditional rectangular cells, long flat "blade" shaped cells are packed directly into the battery pack, increasing space utilisation by over 50% and dramatically improving heat dissipation. In the nail penetration test - the harshest battery safety benchmark - the Blade Battery produced no fire or smoke, with surface temperatures reaching only 30–60°C compared to over 500°C for a typical NCM battery under the same conditions. BYD just launched Blade Battery 2.0 in March 2026, with energy density of 190–210 Wh/kg, support for 8C ultra-fast charging (10–80% in 10 minutes), and over 3,000 charge cycles - making the "EV batteries wear out fast" argument increasingly outdated.
Sodium-IonSodium-ion batteries use sodium - essentially the same element found in table salt - instead of lithium. This means no lithium, no cobalt, no nickel, and no geopolitical supply chain anxiety. CATL, the world's largest battery maker, launched its sodium-ion brand Naxtra in 2025 and confirmed large-scale deployment across passenger vehicles and energy storage in 2026. The Naxtra battery operates across a temperature range of –40°C to 70°C - a significant advantage over LFP in cold climates. The world's first mass-produced sodium-ion EV debuted in February 2026, the Changan Nevo A06, using a 45 kWh sodium-ion pack with around 400 km of real-world range. MIT Technology Review named sodium-ion batteries one of its 10 Breakthrough Technologies for 2026. Sodium-ion won't replace LFP overnight, but it's a meaningful step toward batteries that are cheaper, safer, and completely free of lithium supply chain risk.
Solid-State - The One to Watch (With Honest Caveats)Solid-state batteries replace liquid electrolytes with a solid material, theoretically unlocking higher energy density, faster charging, longer cycle life, and no fire risk. Finnish startup Donut Lab made waves at CES 2026 by claiming the world's first production-ready all-solid-state battery, with specs that sound remarkable: 400 Wh/kg energy density, 5-minute full charge, 100,000-cycle lifespan, and operation from –30°C to 100°C. The technology is being deployed in 2026 Verge Motorcycles starting Q1 2026.
The honest caveat: MIT Technology Review and independent battery scientists have raised legitimate questions about Donut Lab's extraordinary claims, noting that key metrics like energy density and cycle life remain independently unverified. Donut Lab is running a transparency campaign called "I Donut Believe" releasing third-party test results from VTT Technical Research Centre of Finland - two tests published so far show promising high-temperature and fast-charging performance, but the biggest claims are still unproven at scale. Meanwhile, established players like Toyota, CATL, Samsung SDI and BYD are all targeting 2027 or later for their own solid-state production - which gives some perspective on how bold Donut Lab's "available now" claim actually is. Worth watching, but healthy scepticism is warranted.
The Big PictureBattery technology in 2026 looks nothing like 2015 EV batteries. The chemistry is safer, the supply chains are cleaner, the cycle life is longer, and the cost trajectory is firmly downward. The "EV battery will die in 5 years" talking point was always weak - it's now essentially obsolete.
Battery RecyclingTesla operates its own battery recycling program. According to Tesla's Impact Report, they target zero battery landfill and reclaim materials including lithium, cobalt, nickel and copper for reuse. Third party recyclers like Redwood Materials (founded by Tesla's former CTO JB Straubel) are also scaling battery recycling infrastructure significantly.
Recycling infrastructure is still maturing, and full closed-loop recycling at scale is still a work in progress industry-wide - not just Tesla. But the trajectory is strongly in the right direction, and it compares favourably to the ongoing extraction and refining costs of petrol which has no recycling story whatsoever.
What Happens to an EV Battery at End of Life? Black Mass, Second Life & Residual ValueOne question that rarely gets a straight answer in EV vs petrol debates is: what actually happens to the battery when the car is done? The honest answer is that an end-of-life EV battery is not waste - it is a valuable resource with two distinct phases of remaining value before the raw materials are eventually recovered.
-
Phase 1: Second Life - 5 to 10 More Years of Use
When an EV battery drops below roughly 70–80% of its original capacity, it is no longer ideal for a car - but it is perfectly suited for stationary energy storage. Home solar batteries, commercial grid storage, and utility-scale backup systems all operate at lower charge/discharge rates than a moving vehicle, meaning a "retired" EV battery still has substantial useful life ahead of it.
Second-life EV batteries in 2025 offer 5–10 years of additional service in stationary applications, with 80–90% round-trip efficiency and 3,000+ additional charge cycles. They cost 30–70% less than new battery storage - making them attractive for home solar setups, commercial energy management and grid firming. A 2025 study by the University of Münster, Fraunhofer FFB and Lawrence Berkeley National Laboratory found that second-life use saves significantly more CO₂ than immediate recycling - deferring new battery manufacturing and extending the value of materials already mined and processed.
Real-world second-life deployments are already operating at scale: Rome Airport uses retired Nissan Leaf batteries for peak demand management, the Porsche Leipzig plant runs a 1.5MWh system from used EV packs, and multiple automotive OEMs including Nissan, BMW, Audi and Toyota have active second-life programs. For Australian EV owners, a retired car battery could realistically become the battery wall in your home - powered by the same rooftop solar that charged the car.
Phase 2: Black Mass Recycling - Recovering the Raw MaterialsOnce a battery has exhausted its second life, it enters recycling. This is where black mass comes in.
Black mass is the dark, fine powder produced when spent lithium-ion battery cells are mechanically shredded and the casings, copper foil, aluminium foil and plastics are physically separated out. Black mass makes up 40–50% of an EV battery's total weight and contains the concentrated active cathode and anode materials - lithium, cobalt, nickel, manganese and graphite - that were the most expensive and environmentally costly parts to mine originally.
Think of black mass as urban ore: a high-grade mineral mixture recovered from yesterday's batteries rather than dug from the ground. Modern hydrometallurgical recycling processes can recover up to 95% of critical metals from black mass - lithium, cobalt, nickel and manganese - at significantly lower energy cost and CO₂ than primary mining. A new generation of column-based extraction techniques improves recovery rates to ~95% while cutting CO₂ emissions by over 90% compared to traditional mining.
What Is the Black Mass Actually Worth?| End-of-Life Pathway | Timing | Estimated Value | Notes |
|---|---|---|---|
| Second-life sale (battery pack) | When car battery hits ~70–80% capacity Typically 8–15 years after new |
~USD $1,500–$5,000+ per pack [A] (~30–70% of new battery replacement cost) |
LFP batteries (like many Tesla Model Y packs) are particularly well-suited to second life due to their long cycle life and thermal stability. Value depends on remaining capacity and chemistry. [A] |
| Black mass materials value (after second life) | After second-life service ends Typically 15–25 years after new car |
~USD $1,000–$2,000 per pack in recoverable materials [B] Lithium, cobalt, nickel, manganese, graphite, copper |
Raw material value fluctuates with commodity prices. Cobalt and nickel are most valuable; LFP packs have lower black mass value but better second-life economics. Recycler fees or credits vary by region and processor. [B] |
| CO₂ saved vs mining virgin materials | At recycling | ~1.5–3 tonnes CO₂ avoided per battery pack [C] Hydrometallurgical recycling uses 90%+ less CO₂ than primary mining for the same metals |
Recycled battery materials reduce demand for new mining in the DRC (cobalt), Chile/Australia (lithium) and Indonesia/Philippines (nickel). Every recycled pack is one less mine extraction burden. [C] |
| Petrol car equivalent at end of life | At scrapping | ~$300–$800 scrap metal value Steel body, aluminium, copper wiring. Engine, gearbox, exhaust have minimal value as worn components. |
A scrapped petrol car produces no recoverable energy storage value - the fuel it burned is gone, the CO₂ is in the atmosphere, and the supply chain CO₂ that extracted and refined that fuel is also permanently emitted. No second life possible. |
The trajectory here is genuinely promising. The global black mass recycling market was valued at USD $13 billion in 2024 and is projected to reach USD $51.5 billion by 2033, growing at over 16% per year - driven directly by the rising wave of first-generation EV batteries approaching end of life.
Major facilities are now operating: BASF's Schwarzheide plant in Germany processes 15,000 tonnes of batteries per year; LG Energy Solution and Toyota Tsusho have launched a joint venture targeting 13,500 tonnes per year from 2026.
In Australia, Neometals operates battery recycling technology developed in part through Australian research, and the federal government's Critical Minerals Strategy explicitly targets domestic black mass processing as a sovereign capability.
The honest caveat: battery recycling infrastructure, while growing fast, is not yet at the scale needed for the wave of batteries that will retire through the late 2020s and 2030s.
LFP batteries - increasingly common in EVs including Tesla's Australian-market Model Y - contain no cobalt and less nickel, making their black mass less immediately valuable to recyclers than older NMC chemistry packs. The recycling economics for LFP are improving but lithium recovery from LFP black mass remains a developing area. The good news is that LFP's superior cycle life means it is particularly well-suited to second-life stationary storage - delaying the need for recycling while delivering additional clean energy value.
The bottom line: an EV battery is not a liability at end of life - it is an asset with a two-stage value chain. A petrol car's fuel has no recovery value whatsoever. Every litre burned is CO₂ permanently released, with nothing left to recover, reuse, or sell.
Sources for this section:
[A] PMC - Cost, Energy and Carbon Footprint Benefits
of Second-Life EV Battery Use. Second-life battery pricing $72–$300/kWh.
[B] Discovery Alert - EV Battery Recycling vs Second Life 2025.
Average 2025 EV battery contains USD $1,000–$2,000 recoverable materials.
[C] Straits Research - Black Mass Recycling Market 2025–2033.
USD $13B in 2024, projected USD $51.5B by 2033.
New extraction techniques recover ~95% of metals,
cut CO₂ 90%+ vs virgin mining.
[D] Roxia - What Is Black Mass in Battery Recycling and
Why Is It Valuable? Black mass = 40–50% of battery weight,
contains majority of valuable metals.
[E] Benchmark Minerals - What Is Black Mass and
How Is It Priced? Price methodology and market structure explained.
[F] Electrive - Recycling or Second Life?
University of Münster / Fraunhofer / Lawrence Berkeley study, July 2025.
Second life saves more CO₂ than immediate recycling.
[G] Circunomics - Black Mass Recycling:
Up to 95% metal recovery,
hydrometallurgy preferred over pyrometallurgy for lithium recovery.
When my Tesla was new I would see about 108 km range per 20% charge, now I see about 103KM range per 20% charge. A slight drop, The car had a buffer from the factory and tthe drop si in line with degredation predictions
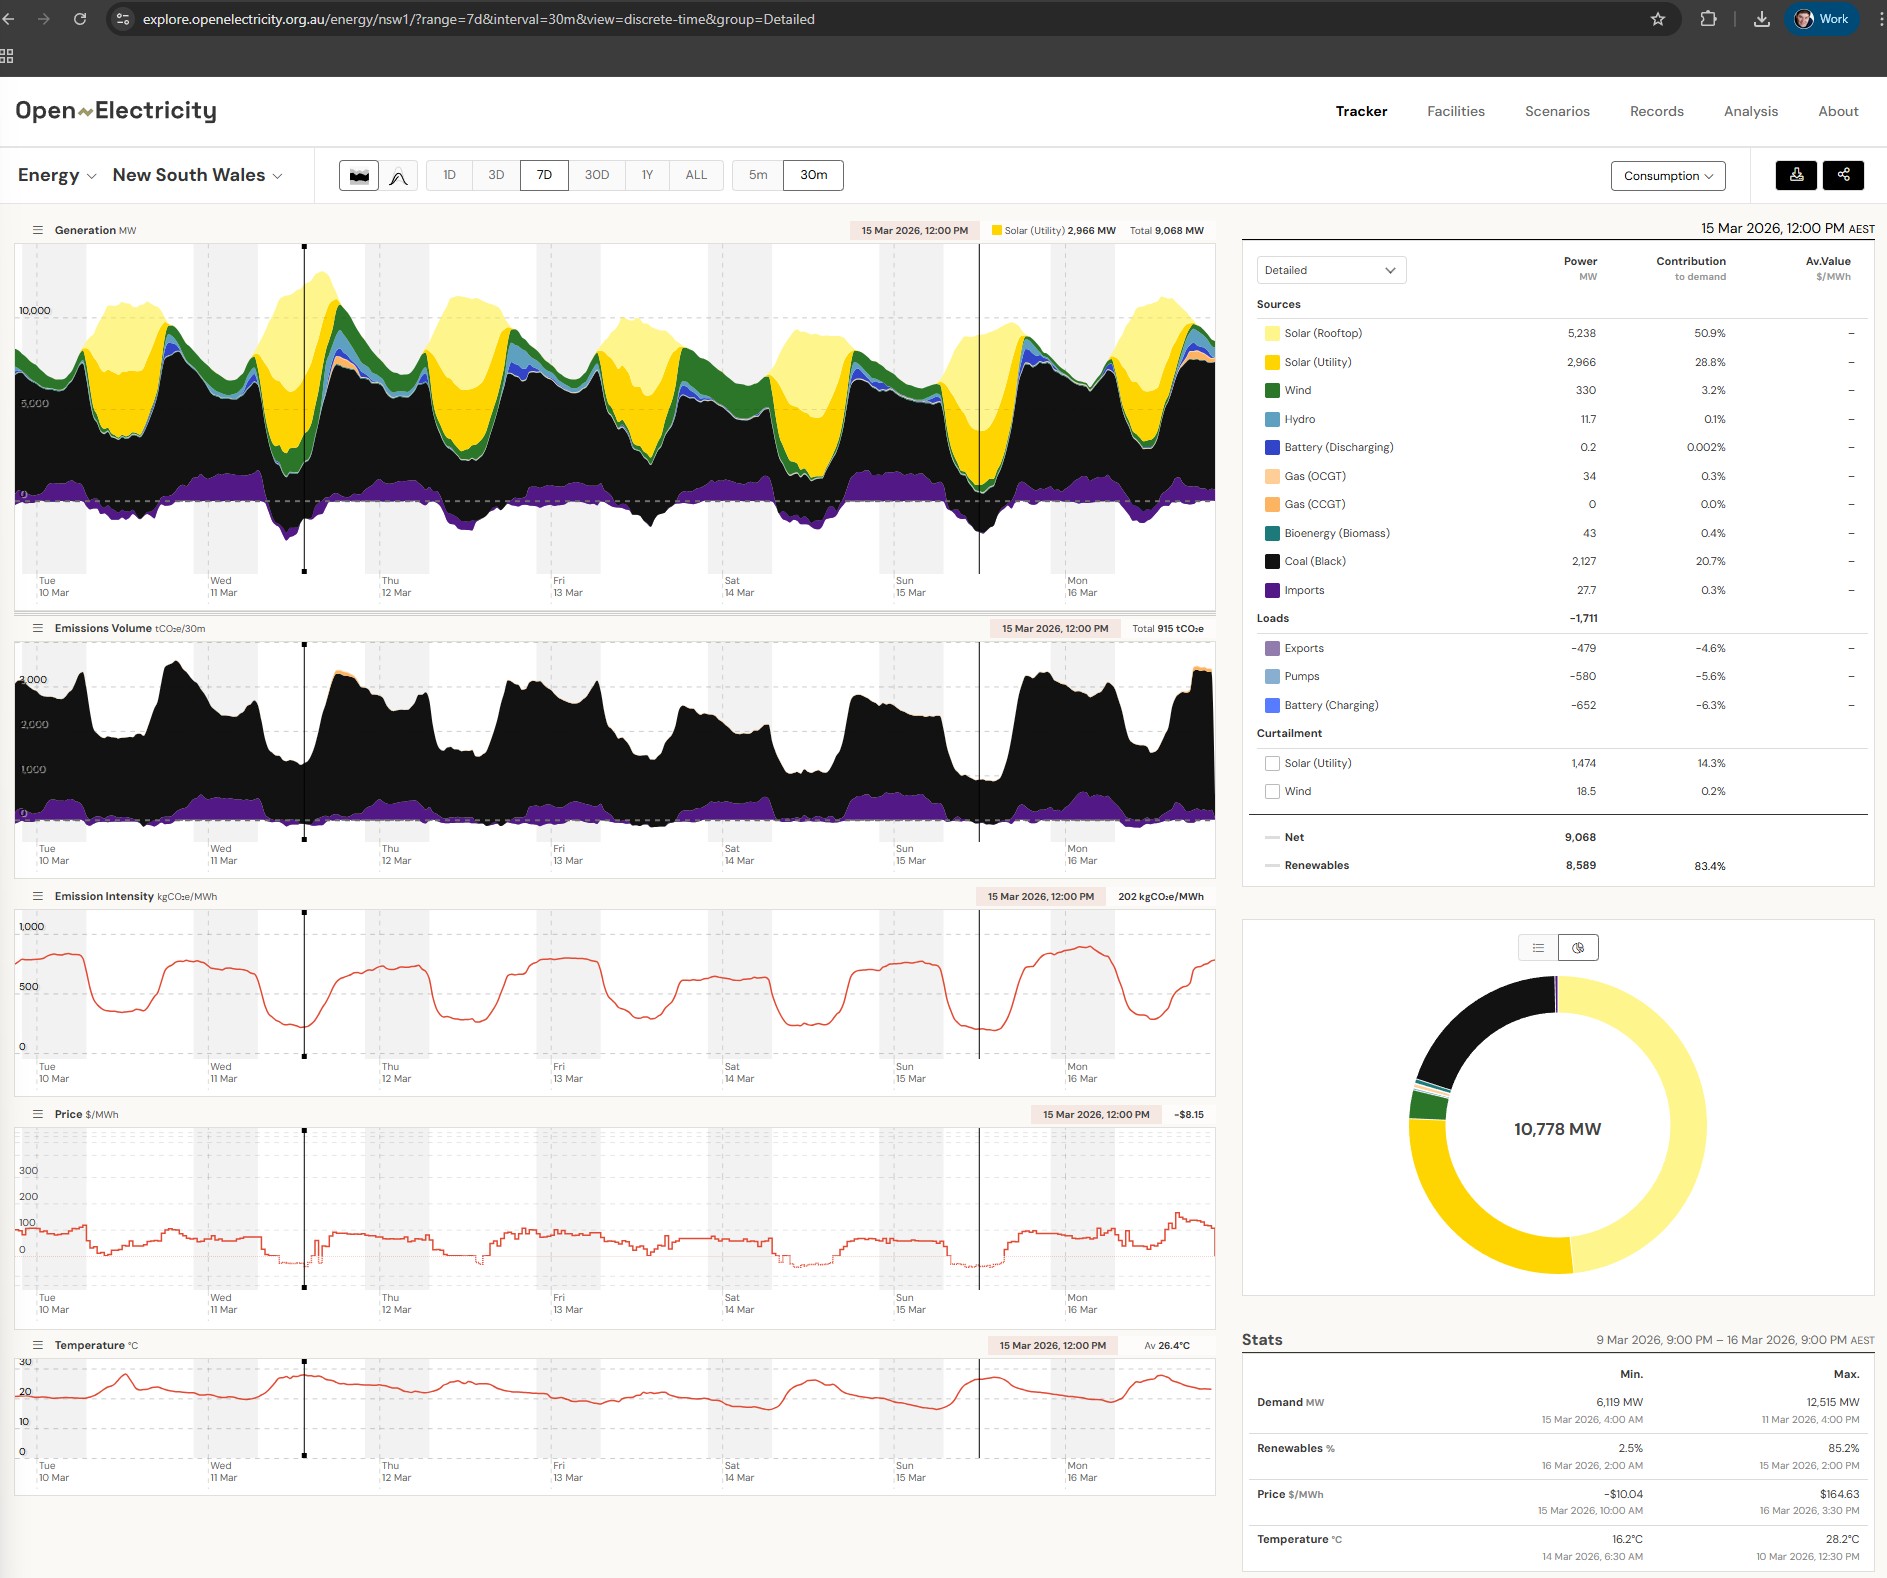
Australian (NSW) Grid StatisticsDuring daylight hours the Australian NEM regularly runs at 70–85%+ renewables, driven by rooftop and utility solar.
During the day and night combined, the Australian NEM grid averaged around ~50% renewables in Q4 2025, up from 37% in 2024, and is on track for 82% by 2030.
Every year the grid gets greener, every EV on the road automatically gets cleaner - a petrol car never improves.
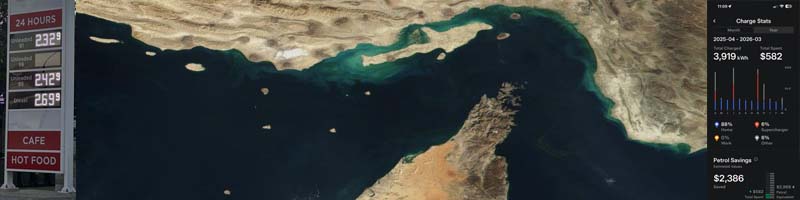
NSW grid at 12:30 PM, 15 March 2026 - 83.3% renewable, emission intensity just 204 kgCO₂e/MWh, wholesale price negative $7.84/MWh. This is when I charge.
Read more about how my car communicates with Origin Energy to ensure power is obtained at 8c kW and not at peak demand times: Automated Tesla charging at home for 8c per kWh via Origin Energy
EV owners who charge during the day - including via the upcoming Solar Sharer free window from July 2026 - are effectively charging on near-renewable power. See live NEM data at Open Electricity.
Lifecycle and emissions data based on Australian conditions. NSW grid data recorded at 12:30 PM 15 March 2026 showed 83.3% renewables with an emission intensity of just 204 kgCO₂e/MWh - typical of daytime solar hours. See live data at Open Electricity NSW.
EV vs Petrol Car: Full Cradle-to-Grave Emissions ComparisonThis is a fully loaded, honest comparison - it includes every CO₂ cost we can quantify: manufacturing the vehicles, manufacturing solar panels and wind turbines that generate the electricity, the full petrol upstream supply chain from crude extraction through refining and distribution, and end-of-life disposal. Most published comparisons omit several of these. We've included them all, with sources, so you can check every number.
Baseline assumptions: Mid-size SUV (comparable to Tesla Model Y vs petrol equivalent). 200,000 km lifetime. Australian conditions. Daytime charging column uses NSW grid data recorded at ~80–83% renewables during solar peak hours (Open Electricity NSW, 15 Mar 2026, 12:30 PM: 83.3% renewables, 204 kgCO₂e/MWh). Solar column assumes home rooftop charging during daylight hours.
What this table includes that most comparisons don't: Petrol figures include the full upstream supply chain - crude extraction, flaring, international shipping (Australia has no domestic refineries), atmospheric distillation, FCC cracking, hydrotreating, blending, wholesale distribution and last-mile tanker delivery. EV figures include battery and vehicle manufacturing carbon, solar panel embodied carbon, and a proportional share of grid wind/solar infrastructure manufacturing (already embedded in grid emission intensity figures). End-of-life recycling is included for all vehicles. All figures are estimates - methodologies vary across studies and real-world results depend on vehicle model, driving style, grid mix, charging schedule and battery chemistry. The table is intended to be directionally accurate and representative, not a precise engineering calculation.
| CO₂ Source | Petrol Car (Full cradle-to-grave) |
EV - Daytime Charging (~80% Renewables, Aus Grid) |
EV - 100% Rooftop Solar | Notes & Sources |
|---|---|---|---|---|
| ① MANUFACTURING PHASE - one-off costs before the car turns a wheel | ||||
| Vehicle body, chassis & powertrain manufacturing | ~6–8 tonnes CO₂ [1][2] Steel, aluminium, plastics, ICE engine, gearbox, exhaust system |
~5–6 tonnes CO₂ [1][2] Similar body/chassis, but simpler electric motor vs complex ICE powertrain |
~5–6 tonnes CO₂ [1][2] Same as above - vehicle body is identical regardless of charging source |
ICCT 2025: ICE vehicle manufacturing ~8t CO₂, EV body (excl. battery) ~5–6t. [1] |
| EV battery pack manufacturing | N/A | ~6–7 tonnes CO₂ [1][2] ~75–85 kgCO₂/kWh for a ~75–80kWh pack. Improving rapidly as battery factories switch to renewables. |
~6–7 tonnes CO₂ [1][2] Same battery - charging source doesn't change manufacturing footprint |
Battery manufacturing is ~50% of EV's total manufacturing CO₂. Now ~75–85 kgCO₂/kWh, down from ~175 kgCO₂/kWh in 2013. [2] |
| Solar panels (home rooftop system, ~10kWp) | N/A | N/A Grid electricity - solar/wind embodied carbon already allocated to grid mix figures below |
~0.3–0.5 tonnes CO₂ (amortised) [3][4] ~41–45 gCO₂/kWh (IPCC/NREL). A 10kWp system generating ~14,000 kWh/yr for 25 years = ~580–630 kgCO₂ total manufacturing. Repaid within 1–3 years of operation. Amortised over EV charging lifetime: ~0.3–0.5t. |
IPCC median: 41 gCO₂e/kWh. NREL utility-scale: 36 gCO₂e/kWh. Energy payback: 0.5–3 years. [3] [4] |
| Grid solar & wind infrastructure (share allocated per EV) |
N/A Petrol infrastructure (refineries, pipelines, tankers, servo stations) not typically counted - also a large ongoing cost |
~0.2–0.5 tonnes CO₂ (amortised) [5][6] Onshore wind: 7–15 gCO₂/kWh lifetime. Utility solar: 33–50 gCO₂/kWh lifetime. Already included in the grid emission intensity figure used in operational rows below. |
Negligible additional - already covered by rooftop solar row above | Wind: 7–15 gCO₂/kWh (IPCC 2025). Solar: 33–50 gCO₂/kWh. Both repaid within months to 3 years. [5] [6] |
| Manufacturing Subtotal | ~6–8 tonnes CO₂ | ~12–14 tonnes CO₂ Higher upfront - but repaid within ~17,000–27,000 km |
~12–14 tonnes CO₂ Same vehicle; solar panel embodied carbon is a small fraction repaid within years |
EV starts with a "carbon debt" of ~4–6t over a petrol car - repaid within 1–2 years of typical Australian driving. [7] |
| ② OPERATIONAL PHASE - every kilometre driven, over 200,000 km lifetime | ||||
| Crude oil extraction & flaring | ~5–8 g/km (~1.0–1.6t over 200,000km) [8][9] Drilling, pumping, methane flaring at wellhead |
Zero | Zero | Carbon intensity of crude varies 4–50 gCO₂eq/MJ by source. Australia imports from Middle East, US, SE Asia. [8] [9] |
| Crude shipping to refinery | ~2–3 g/km (~0.4–0.6t over 200,000km) [8] Tanker transport - Australia has no domestic refineries, all crude must be shipped internationally |
Zero | Zero | Australia closed its last refineries in 2021–2022. All refined fuel is now imported - adding shipping CO₂ that domestic refiners avoided. [8] |
| Refinery processing (Distillation, FCC, Hydrotreating, Blending) |
~8–12 g/km (~1.6–2.4t over 200,000km) [10][11] Atmospheric distillation, vacuum distillation, FCC cracking, hydrotreating, catalytic reforming, blending to spec. Energy-intensive processes burning ~6–10% of crude throughput as fuel. |
Zero | Zero | Refining adds 13–19 gCO₂eq/MJ of gasoline. FCC and hydrotreating are the most carbon-intensive steps. [10] [11] |
| Wholesale distribution & last-mile tanker delivery | ~3–5 g/km (~0.6–1.0t over 200,000km) [11] Fuel shipped from overseas refinery to import terminal, then tanker trucks to service stations |
Zero | Zero | Upstream WTT (Well-to-Tank) total for petrol adds approximately 18% above tailpipe figures. [11] |
| Tailpipe combustion CO₂ | ~181 g/km (~36.2t over 200,000km) [12] Australian average new light vehicle 2019. This is the only number most comparisons use. |
Zero | Zero | Australian Green Vehicle Guide average. All other petrol rows above are typically omitted from standard comparisons. [12] |
| Electricity generation upstream CO₂ (charging emissions) |
N/A | ~8–15 g/km (~1.6–3.0t over 200,000km) [13][14] Based on daytime NSW grid ~80–83% renewables, ~204 kgCO₂e/MWh emission intensity. Includes proportional share of wind/solar manufacturing embodied carbon already allocated in grid emission intensity figures. |
~1–3 g/km (~0.2–0.6t over 200,000km) [3][4] Solar panel embodied carbon (~41 gCO₂/kWh) divided across lifetime generation. Panels repay manufacturing carbon within 1–3 years. After payback: effectively zero. |
Grid emission intensity includes embodied carbon of wind/solar infrastructure proportionally allocated per kWh. [13] [14] |
| Operational Subtotal (200,000 km) |
~39–43 tonnes CO₂ Tailpipe: 36.2t + upstream supply chain: 3–7t |
~1.6–3.0 tonnes CO₂ Grid electricity upstream only - no tailpipe, no refinery, no tankers |
~0.2–0.6 tonnes CO₂ Solar panel embodied carbon amortised - approaches zero after payback period |
Petrol operational CO₂ is 13–25× higher than EV on 80% renewable grid. Compared to rooftop solar EV: 65–200× higher. [15] |
| ③ END OF LIFE | ||||
| Vehicle recycling / disposal | ~0.3–0.5 tonnes CO₂ [2] | ~0.3–0.5 tonnes CO₂ [2] Battery recycling adds some cost but recovers valuable lithium, cobalt and nickel - reducing future mining demand |
~0.3–0.5 tonnes CO₂ [2] | Battery recycling is improving rapidly. Second-life battery use in home storage extends value before final recycling. [16] |
| GRAND TOTAL Cradle-to-Grave (200,000 km) |
~46–52 tonnes CO₂ Manufacturing: ~7t Tailpipe: ~36t Upstream supply chain: ~3–7t End of life: ~0.4t |
~14–18 tonnes CO₂ Manufacturing (incl. battery): ~13t Charging (80% renewables): ~2t Grid infrastructure share: included in above End of life: ~0.4t |
~13–15 tonnes CO₂ Manufacturing (incl. battery): ~13t Solar panel embodied: ~0.4t Charging operational: ~0.3t End of life: ~0.4t |
EV on 80% renewables: ~65–73% lower lifetime CO₂ than petrol. EV on 100% solar: ~72–75% lower. The gap between 80% grid and 100% solar is small - most EV lifetime CO₂ is now in manufacturing, not charging. [7] |
| Key insight | 80%+ of lifetime CO₂ comes from burning fuel and its supply chain - permanently, every km | ~80% of lifetime CO₂ is now in manufacturing. Charging emissions shrink every year as grid gets greener - automatically, without changing the car | ~87–90% of lifetime CO₂ is in manufacturing. Once panels pay back their carbon (1–3 yrs), every subsequent km driven is near-zero carbon | A petrol car bought today emits the same CO₂/km on its last day as its first. An EV bought today gets cleaner every year as Australia adds more renewables. |
| ④ OTHER EMISSIONS - non-CO₂ air quality impacts | ||||
| NOx (Nitrogen Oxides) | High - regulated, Euro 5 [12] | Zero tailpipe | Zero tailpipe | Major contributor to urban smog and respiratory disease. Zero from EV drivetrain at street level. |
| Carbon Monoxide (CO) | Present - regulated | Zero tailpipe | Zero tailpipe | Produced by incomplete combustion. Toxic at elevated concentrations. |
| Hydrocarbons / VOCs | Present - regulated | Zero tailpipe | Zero tailpipe | Contribute to ground-level ozone and smog. |
| Exhaust PM2.5 particulates | Present from combustion | Zero tailpipe | Zero tailpipe | Linked to lung disease, cardiovascular disease and premature death in urban areas. |
| Tyre & brake dust particulates | Present | Similar tyre dust; significantly less brake dust [17] | Similar tyre dust; significantly less brake dust [17] | Honest caveat: EVs are heavier, marginally increasing tyre wear particulates. However regenerative braking dramatically reduces brake dust - brakes are rarely used hard. [17] |
- [1] ICCT - Why EVs Are Already Much Greener Than ICE Vehicles (Jul 2025).
BEV manufacturing ~12t CO₂, ICE ~8t CO₂.
- [2] MDPI - Life-Cycle CO₂ Emissions of Cars: Conventional vs Electric Propulsion.
BEV production 14t CO₂, ICEV 7.5t CO₂.
- [3] Advanced Power Alliance / NREL - Solar Panel Lifecycle Emissions:
43 gCO₂e/kWh. 20× less than coal per kWh.
- [4] NREL - Updated Life Cycle Assessment of Utility-Scale Solar PV.
36 gCO₂e/kWh. Energy payback 0.5–1.2 years.
- [5] Business Norway / IPCC 2025 - Wind Turbine Lifecycle Carbon:
Onshore 7–11 gCO₂e/kWh, offshore 8–14 gCO₂e/kWh.
- [6] Yale Climate Connections - Wind Turbine Carbon Footprint:
5–26 gCO₂e/kWh across all configurations.
- [7] ICCT - Life-Cycle GHG Emissions from Passenger Cars, 2025 Update.
BEV 73% lower than gasoline ICEV on average EU grid.
- [8] ICCT - Carbon Intensity of Crude Oil: Extraction, Flaring and Refining.
Average upstream intensity 12 gCO₂eq/MJ.
- [9] IEA - Emissions from Oil and Gas Operations in Net Zero Transitions.
450 Mt CO₂ from oil extraction/refining/transport globally in 2022.
- [10] Concawe / EU - CO₂ Intensities of EU Refinery Products.
FCC and hydrotreating major refinery emission sources.
- [11] WinACC - GHG Emissions Guidelines for Transport.
Upstream WTT adds ~18% to petrol combustion CO₂.
- [12] Australian Green Vehicle Guide - Vehicle Emissions.
Aus average new light vehicle: 181 gCO₂/km (2019).
- [13] Open Electricity NSW - Live Grid Data.
83.3% renewables, 204 kgCO₂e/MWh recorded 15 Mar 2026, 12:30 PM AEST.
- [14] ElectricityProvider.com.au - EV vs Petrol: Australian Cost & Emissions.
- [15] Recurrent Auto - Full Lifecycle EV vs Petrol Emissions.
EV produces 110 gCO₂/mile vs 410 gCO₂/mile for petrol over lifetime.
- [16] US Dept of Energy AFDC - Well-to-Wheel and Cradle-to-Grave
EV Emissions Explained.
- [17] ScienceDirect - Lifecycle Carbon Footprint: ICE vs EV Transit Vehicles.
Tyre and brake particulate comparison.
- [18] PV Magazine - Australian Renewables Exceed 50% of Power Supply Q4 2025.
Few EV myths are more persistent than the idea that electric cars are ticking fire bombs. It makes headlines every time it happens - because it is rare enough to be newsworthy. Here is what the verified Australian and international data actually shows.
The Australian Numbers
- 4 occurred after major collision or physical damage to the battery pack
- 2 were caused by arson - the car was deliberately lit
- 3 were vehicles caught in building fires that spread to the car
- 1 was connected to charging at the time
In other words: of 10 total verified EV fires in Australia across the entire history of EVs here, zero were spontaneous battery failures during normal driving or parked charging in the open. The Australian Government's own energy department recorded 12 EV battery fires as of October 2025 - consistent with the same picture.
Compare that to petrol cars. Fire and Rescue NSW recorded 2,803 internal combustion vehicle fires in NSW alone in the 2022–23 financial year. That is one state, one year. Against roughly 10 verified EV fires across the whole country across the entire history of EVs in Australia.
Global Context| Metric | Electric Vehicles | Petrol / Diesel Vehicles | Source |
|---|---|---|---|
| Verified fires in Australia (all time to Oct 2025) |
12 (road-registered passenger EVs) | 2,803 in NSW alone in 2022–23 | energy.gov.au / Qld Treasury |
| Estimated fire rate | ~0.001–0.002% of EVs | ~0.1% of ICE vehicles | Swinburne University / EV FireSafe |
| Relative fire risk | Baseline | 20 to 80× more likely to catch fire | Electric Vehicle Council Australia / Swinburne University |
| Verified global EV battery fires (2010 to June 2024) |
511 verified - out of ~40 million EVs on the road | Not tracked globally - far too numerous to count | EV FireSafe / Electric Vehicle Council |
| Sweden 2022 (controlled national data) |
23 EV fires from 611,000 EVs (0.004%) | 3,400 fires from 4.4 million ICE vehicles (0.077%) | Swedish Civil Contingencies Agency via Qld Treasury |
| Norway 2022 (world's highest EV penetration) |
0.005% fire rate for EVs | 0.03% fire rate for ICE vehicles - 6× higher | Norwegian Fire Service via VESR |
| Poland 2020–2025 (51,142 total vehicle fires) |
87 EV fires (0.17% of all vehicle fires) | 50,833 ICE fires (99.39% of all vehicle fires) | Polish State Fire Service via Interesting Engineering |
| Global fire rate estimate (per 100,000 vehicles) |
~25 fires per 100,000 EVs | ~1,530 fires per 100,000 ICE vehicles | BlazeStack - EV Fire Data 2024–2025 |
The data is clear that EV fires are far rarer than petrol fires. But it is also honest to acknowledge that when an EV battery does catch fire, it presents different challenges for emergency services. Lithium battery fires burn at extremely high temperatures, can last for extended periods, and carry a risk of reignition even after the visible fire appears to be out. They can also emit toxic gases during combustion. Fire services across Australia, including Fire and Rescue NSW, have developed specific EV fire response protocols and training programs to handle this.
It is also worth noting that e-bikes and e-scooters - often using cheaper, lower-quality lithium cells without the thermal management systems found in EVs - have a significantly higher fire rate than passenger electric cars. These are a separate category and should not be conflated with EV car safety statistics.
Why Does It Feel Like EVs Catch Fire All the Time?Because confirmation bias and media attention work together. When a petrol car burns at the side of the road - which happens multiple times a day across Australia - it rarely makes the news. When an EV catches fire anywhere in the country, it is likely to generate national coverage. The Electric Vehicle Council notes this directly: EVs are a new technology and EV fires attract disproportionate attention relative to their actual frequency.
The data does not lie. In Australia, you are statistically far safer from a fire risk in an EV than in a petrol car. The FUD around EV fires is one of the most well-documented and consistently refuted myths in the space - and it has been refuted not by EV advocates, but by fire services, government agencies, and independent researchers across multiple countries.
Sources:
Vehicle Emissions Star Rating (VESR) - EV Fire Safety in Australia.
10 verified Australian EV fires to January 2025, breakdown by cause.
Australian Government energy.gov.au - Electric Vehicle Facts.
12 EV battery fires recorded to October 2025.
Electric Vehicle Council Australia - Are EV Fires Common?
6 verified Australian EV fires to June 2024. 511 verified globally 2010–2024.
EVs 20× less likely to catch fire than petrol/diesel (Sweden data).
Queensland Treasury - Electric Vehicles Fact Check.
2,803 ICE vehicle fires in NSW alone in 2022–23.
Sweden: 23 EV fires vs 3,400 ICE fires in 2022.
Swinburne University - EV Fire Risk Analysis.
Fire risk 20–80× greater for petrol/diesel vehicles.
EV fire rate 0.0012%, ICE fire rate ~0.1%.
EV Fire Solutions Australia - EV Fire Safety 2025.
Poland: EVs 0.17% of all vehicle fires; ICE 99.39%.
Globally ~1 EV fire per 100,000 vehicles.
Interesting Engineering - Do EVs Really Catch Fire More?
EV fire risk 0.001–0.002% vs ICE ~0.1%.
Poland 2020–2025: 87 EV fires vs 50,833 ICE fires.
Fire and Rescue NSW - EV and EV Charging Equipment
Fire Safety Position Paper.
EV Fires in Australia - What the Data Actually Shows
Few EV myths are more persistent than the idea that electric cars are ticking fire bombs. It makes headlines every time it happens - because it is rare enough to be newsworthy. Here is what the verified Australian and international data actually shows.
The Australian Numbers
- 4 occurred after major collision or physical damage to the battery pack
- 2 were caused by arson - the car was deliberately lit
- 3 were vehicles caught in building fires that spread to the car
- 1 was connected to charging at the time
In other words: of 10 total verified EV fires in Australia across the entire history of EVs here, zero were spontaneous battery failures during normal driving or parked charging in the open. The Australian Government's own energy department recorded 12 EV battery fires as of October 2025 - consistent with the same picture.
Compare that to petrol cars. Fire and Rescue NSW recorded 2,803 internal combustion vehicle fires in NSW alone in the 2022–23 financial year. That is one state, one year. Against roughly 10 verified EV fires across the whole country across the entire history of EVs in Australia.
Global Context
| Metric | Electric Vehicles | Petrol / Diesel Vehicles | Source |
|---|---|---|---|
| Verified fires in Australia (all time to Oct 2025) |
12 (road-registered passenger EVs) | 2,803 in NSW alone in 2022–23 | energy.gov.au / Qld Treasury |
| Estimated fire rate | ~0.001–0.002% of EVs | ~0.1% of ICE vehicles | Swinburne University / EV FireSafe |
| Relative fire risk | Baseline | 20 to 80× more likely to catch fire | Electric Vehicle Council Australia / Swinburne University |
| Verified global EV battery fires (2010 to June 2024) |
511 verified - out of ~40 million EVs on the road | Not tracked globally - far too numerous to count | EV FireSafe / Electric Vehicle Council |
| Sweden 2022 (controlled national data) |
23 EV fires from 611,000 EVs (0.004%) | 3,400 fires from 4.4 million ICE vehicles (0.077%) | Swedish Civil Contingencies Agency via Qld Treasury |
| Norway 2022 (world's highest EV penetration) |
0.005% fire rate for EVs | 0.03% fire rate for ICE vehicles - 6× higher | Norwegian Fire Service via VESR |
| Poland 2020–2025 (51,142 total vehicle fires) |
87 EV fires (0.17% of all vehicle fires) | 50,833 ICE fires (99.39% of all vehicle fires) | Polish State Fire Service via Interesting Engineering |
| Global fire rate estimate (per 100,000 vehicles) |
~25 fires per 100,000 EVs | ~1,530 fires per 100,000 ICE vehicles | BlazeStack - EV Fire Data 2024–2025 |
When EV Fires Do Happen
The data is clear that EV fires are far rarer than petrol fires. But it is also honest to acknowledge that when an EV battery does catch fire, it presents different challenges for emergency services. Lithium battery fires burn at extremely high temperatures, can last for extended periods, and carry a risk of reignition even after the visible fire appears to be out. They can also emit toxic gases during combustion. Fire services across Australia, including Fire and Rescue NSW, have developed specific EV fire response protocols and training programs to handle this.
It is also worth noting that e-bikes and e-scooters - often using cheaper, lower-quality lithium cells without the thermal management systems found in EVs - have a significantly higher fire rate than passenger electric cars. These are a separate category and should not be conflated with EV car safety statistics.
When people hear "lithium battery fire" they often picture an EV — but the fires making headlines are far more likely to involve an e-scooter, a cheap power bank or an uncertified phone charger than a car. Passenger EVs carry sophisticated Battery Management Systems that monitor every cell in real time, manage heat with active liquid cooling loops, and cut power the moment something looks wrong. Your iPhone has some of this. A $200 scooter from a discount catalogue very likely does not.
Why Does It Feel Like EVs Catch Fire All the Time?
Because confirmation bias and media attention work together. When a petrol car burns at the side of the road - which happens multiple times a day across Australia - it rarely makes the news. When an EV catches fire anywhere in the country, it is likely to generate national coverage. The Electric Vehicle Council notes this directly: EVs are a new technology and EV fires attract disproportionate attention relative to their actual frequency.
The data does not lie. In Australia, you are statistically far safer from a fire risk in an EV than in a petrol car. The FUD around EV fires is one of the most well-documented and consistently refuted myths in the space - and it has been refuted not by EV advocates, but by fire services, government agencies, and independent researchers across multiple countries.
Sources:- Vehicle Emissions Star Rating (VESR) - EV Fire Safety in Australia. 10 verified Australian EV fires to January 2025, breakdown by cause.
- Australian Government energy.gov.au - Electric Vehicle Facts. 12 EV battery fires recorded to October 2025.
- Electric Vehicle Council Australia - Are EV Fires Common? 6 verified Australian EV fires to June 2024. 511 verified globally 2010–2024. EVs 20× less likely to catch fire than petrol/diesel (Sweden data).
- Queensland Treasury - Electric Vehicles Fact Check. 2,803 ICE vehicle fires in NSW alone in 2022–23. Sweden: 23 EV fires vs 3,400 ICE fires in 2022.
- Swinburne University - EV Fire Risk Analysis. Fire risk 20–80× greater for petrol/diesel vehicles. EV fire rate 0.0012%, ICE fire rate ~0.1%.
- EV Fire Solutions Australia - EV Fire Safety 2025. Poland: EVs 0.17% of all vehicle fires; ICE 99.39%. Globally ~1 EV fire per 100,000 vehicles.
- Interesting Engineering - Do EVs Really Catch Fire More? EV fire risk 0.001–0.002% vs ICE ~0.1%. Poland 2020–2025: 87 EV fires vs 50,833 ICE fires.
- Fire and Rescue NSW - EV and EV Charging Equipment Fire Safety Position Paper.
TLDR = Too Long, Did Not Read
An EV is a car that gets you from A to B. Is very chaep to charge and maintain. You will exchange the convenience of paying for expensive petrol delivered fast to waiting to charge for cheap.
An EV is 90% less complex than an Internal Combustion Engine and not reliant on world Oil Flow. More of the money you spend on Electricity to charge stays in Australia compared to Petrol.
Live Australia Grid Supply and Demand Chart
View the live Australian Energy Market Operator (AEMO) live Electricity Price per MW here: https://aemo.com.au/
Referral Links
If you found this post helpful and are considering purchasing a Tesla or charger, please consider using these discount links below.